TariffShark Tiger User Guide
Not your version?Grids
Overview
TariffShark displays lists of data, such as Tariffs, Filings, and Tariff Record Versions in tabular form known as grids. And it provides you with the ability to customize and manipulate these grids much like you can in Microsoft Excel. You can sort, filter and even rearrange or hide columns. You can also copy data and paste it into Microsoft Excel worksheets or Microsoft Word tables as you require.
Topics
- Changing Grid's View
- Filters
- Row Count
- Grouping
- Copying Grid Data
- Use "Find Panel" to Search
- Resetting Grid Layout
Changing Grid's View
You can change the layout of the data list view.
Sizing Columns
To size a column:
Do one of the following:
Hover the mouse pointer over the right border of the column header until it turns into a double-sided arrow, and drag the border to the position you want.
To expand a column in order fit the contents, with the double-sided arrow showing, double-click on it.
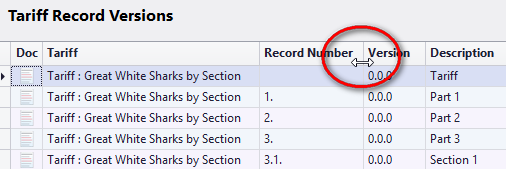 Figure 1: Increase or decrease column width
 Video: Increase or decrease column width
- Best Fit Command, Single Column: Right-click the column header, and select "Best Fit".
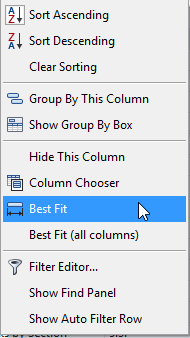 Figure 2: Best Fit for a single column
- Best Fit Command All Columns: Right-click the column header, and select "Best Fit(all columns)".
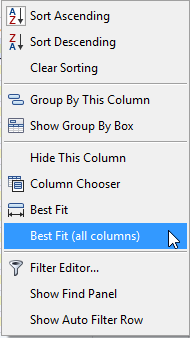 Figure 3: Best Fit (all columns)
Sorting Columns
Almost all of the grids in TariffShark can be sorted by any visible column in the grid simply by clicking the column heading. If you click a column heading and an arrow doesn't appear in the column heading, you are working with one of the few grids in TariffShark that cannot be sorted or an unsortable column.
To sort by a column:
Do one of the following:
- Click the column header to toggle between ascending and descending sort. The sort icon will appear to indicate which way the column is being sorted.
![]() Figure 4: Sort Icon
Figure 4: Sort Icon
- Right-click the column header, and select "Sort Ascending" or "Sort Descending". "Clear Sorting" will remove all sorting in your grid.
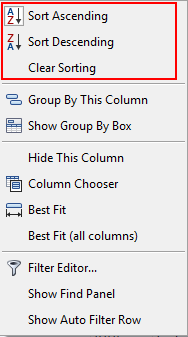 Figure 5: Sort Commands
To sort by multiple columns:
- Hold down the Shift key, and click each column header once or twice to sort ascending or descending.
Changing Column Order
To change the order of the columns:
- Click and drag the column header to the order you want. Example: In the image below, click the column header, hold down and drag it. The double vertical arrows show where the column will be moved to.
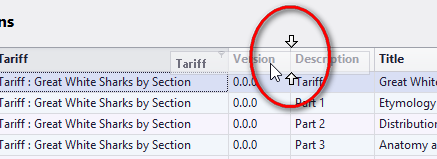 Figure 6: Moving a column by dragging
 Video: Moving columns around
Adding Columns
Using the "Column Chooser"
- Right-click a column header, and select "Column Chooser".
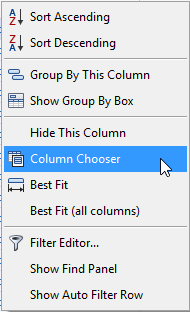 Figure 7: Column Chooser Command
- Drag the headers of the columns that you want to display into the Column Chooser Form. The column is removed from the grid.
- Drag the column header's name from the data list back into the grid to add it back. This also allows you to customize the grid layout.
 Video: Column Chooser Form
Removing Columns
To remove a column:
Do ONE of the following:
- Right-click on the header of the column you want to remove, and select "Hide This Column".
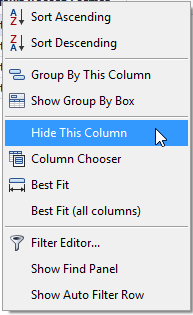 Figure 8: Hide This Column Command
- Click and drag the column header into the data list, and release it when you see the "X". Right click on the bottom of the grid and select "Reset Grid" to restore the column.
 Video: Drag to Hide Column
Changes to grid layouts will be automatically saved
TariffShark will retain any grid column rearranging, adding, and/or removing even when a tab is closed or when logging off and logging back in. To restore grid layouts see resetting grid data below.Filters
Applying Basic Filters
TariffShark allows you to select a column and filter to records that have a specific value for that column.
- Filtering to Blank Fields
- Filtering to Non-Blank Fields
- Filtering to a Specific Value
- Filtering to Checkboxes
- Filtering by Date
For information on filtering to data that is more than one value or that is within a range of values, refer to Creating a Custom Filter.
Filtering to Blank Fields
If you filter to blanks, only records that do not have a value entered in a field are listed.
- Hover the mouse pointer over the header of the column where you want to apply the filter, and click the filter icon.
![]() Figure 9: Filter Icon
Figure 9: Filter Icon
At the filter menu, select (Blanks).
Example: If you are in the Response column and filter to Blanks, only TRVs that do not have a response are listed.
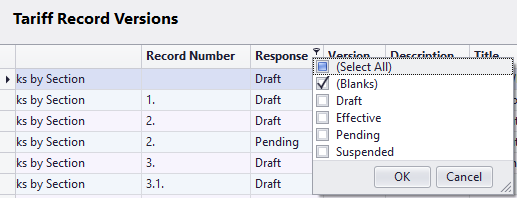 Figure 10: Filter Blanks
The records that have a value in the column you chose display, and the filter status area at the bottom of the screen shows that a filter is applied.
 Figure 11: Results of Filter "Blanks"
Filtering to Non-blank Fields
Or you can choose to filter to any non-blank field. Any string-grid column in TariffShark will display an alphabetically checkbox list when the filter icon is clicked. Check any number of boxes and hit "OK" to filter.
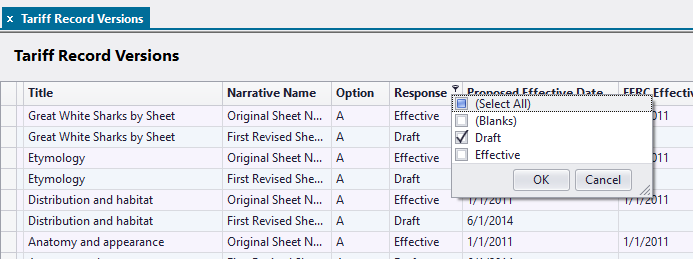 Figure 12: Filtering a Non-blank Field
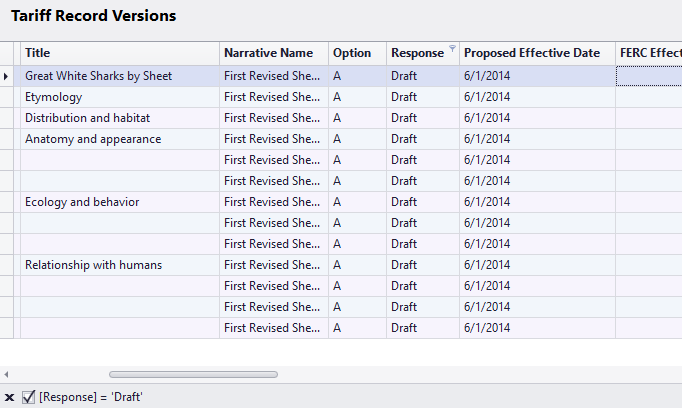 Figure 13: Results of Filtering a Non-blank Field
Filtering to a Specific Value
If you filter by a specific value, only records that have that value for the field you select display.
- Hover the mouse pointer over the header of the column where you want to apply the filter, and click the filter icon. At the filter menu, select the value you want.
Example: If you select 1.0.0 in the Version column, only TRVs Version 1.0.0 are shown.
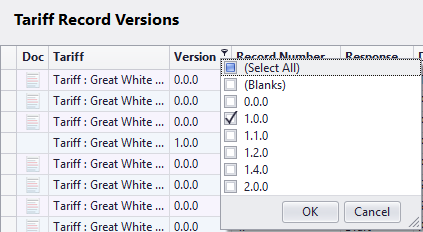 Figure 14: Filter Specific Value
The records that are checked in the column you chose display, and the filter status area at the bottom of the screen shows that a filter is applied.
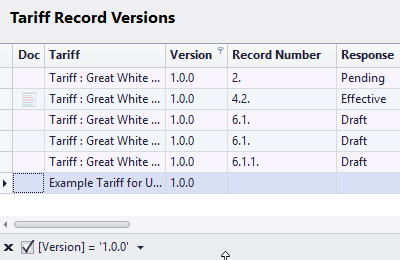 Figure 15: Results of Filter "Specific Value"
Filtering to Checkboxes
If a field is a checkbox, you can filter to all records that are have the checkbox selected or unselected (unchecked).
To filter to selected checkboxes:
- Hover the mouse pointer over the header of the column where you want to apply the filter, and click the filter icon. At the filter menu, select Unchecked.
Example: If you want to view all Tariff Databases without Hierarchy Support, you can filter to show only Tariff Databases that have Hierarchy Support column unchecked.
 Figure 16: Filter Unchecked
The records that are checked in the column you chose display, and the filter status area at the bottom of the screen shows that a filter is applied.
 Figure 17: Results of Filter "Unchecked"
Filtering by Date
For data that is in date format, you can filter records by date.
Depending on the date field, you get different date filtering options.
- Hover the mouse pointer over the header of the column that you want to apply the filter, and do the following:
- Click the filter icon.
- Select the date.
- Click OK.
Example: If you want to view any TRV that had a specific FERC Effective Date of 1/1/2011.
 Video: Date checked
For date ranges or dates between, before or after other specific dates, refer to Custom Filtering to Dates with the Filter Editor.
Creating a Custom Filter with the Filter Editor
The Filter Editor allows you to build complex filter criteria with an unlimited number of filter conditions, combined by logical operators. You can enable a Tree-Like or text-based filter editing style or use both styles.
Right-click on any column and select "Filter Editor" ...
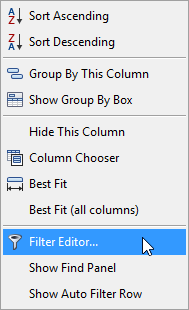 Figure 18: Open Filter Editor
The Filter Editor opens ...
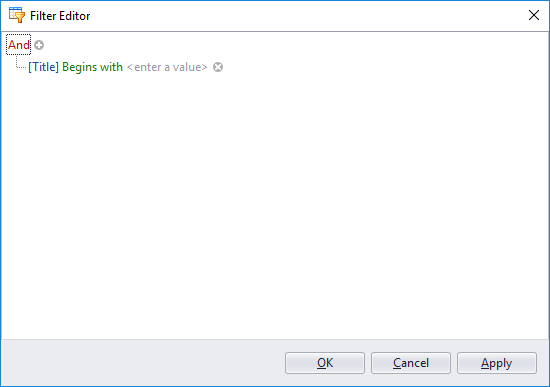 Figure 19: Filter Editor Form
The following topics are presented as additional details about the Filter Editor:
- Expressions and Options
- To create a custom filter from the filter editor
- Custom Date Filtering using the Filter Editor
Expressions and Options
The Filter Editor includes the following expressions and options:
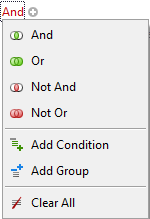 Figure 20: Filter Expressions and Options
Expressions:
- And - Gives you any records that fit ALL criteria you list.
- Or - Gives you the total records that fit any criteria you list.
- Not And - Gives you any records that do NOT fit all the criteria you list.
- Not Or - Gives you any records that do not fit ANY criteria that you list.
Options:
- Add Condition - Adds criteria to the list.
- Add Group - Allows you to add more complex criteria.
- Clear All - Clears your criteria list.
To create a custom filter from the filter editor:
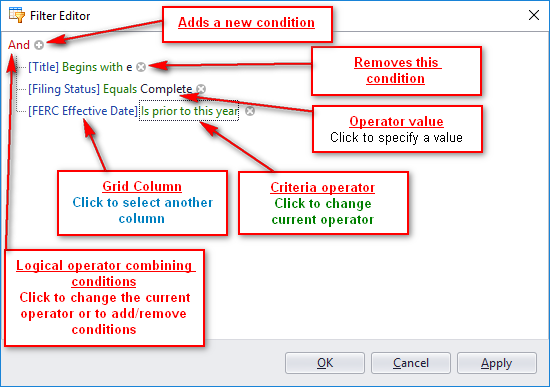 Figure 21: Filter Editor, Details
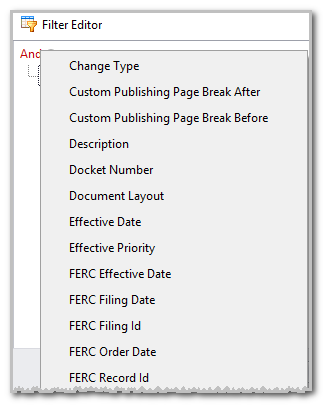 Figure 22: Filter Editor, Columns
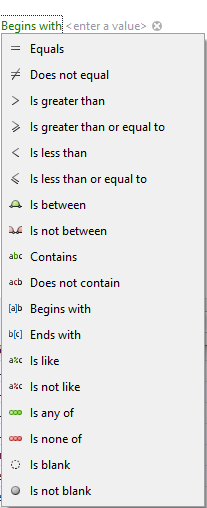 Figure 23: Filter Editor, Criteria Operators
From a grid, right-click the head of one of the columns you want to base the filter on, and select Filter Editor. The video below shows an example of filtering Titles that begin with the letter "e" and that have a Filing Status of "complete"
 Video: Filter Editor
The rows that match the filter criteria display and the filter status area shows that a filter is applied.
Custom Date Filtering using the Filter Editor
Using the Filter Editor, you can filter to dates with date ranges, or before or after certain dates by selecting a date's grid column and then using criteria operators and dates as operator values to determine what to display. In the video below, first we filter to dates in a range (between two operator values) and then we filter to all dates prior to the current date. Note: that there are two sets of criteria operators: one general and one subsets for date and times.
 Video: Using the Filter Editor for advanced date filtering
Row Count
The Row Count function tells you how many rows their are in a grid. This is useful in telling you at a glance how many Elements there are based on the current conditions (for example, how many Filings you have in total).
- Hover your mouse over the empty far left column header and the number of rows appears. There are 7 Filings in the grid below.
 Figure 24: Row Count
If a filter is applied, the count will show you how many Elements meet those conditions out of the total.
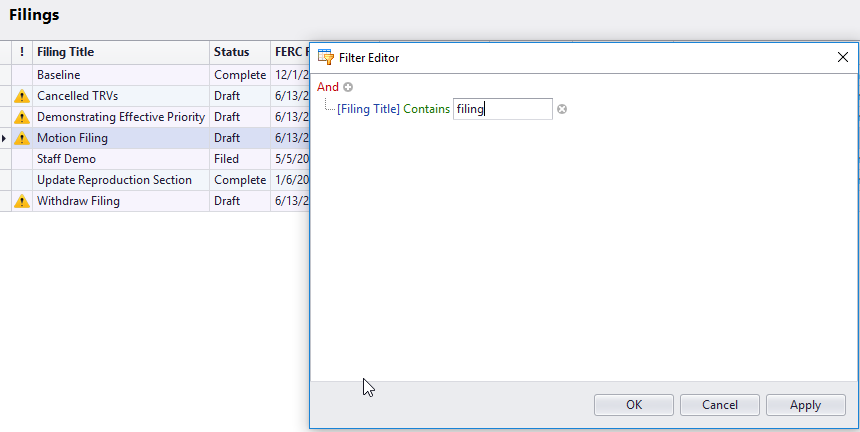 Figure 25: Applying Filter
- Filtering by any Filing Titles containing "filing" the Row Count function displays 2 of 7 rows.
 Figure 26: Row Count with Filter Applied
Grouping
Grouping Data by Column
For each column you want to group by, do ONE of the following:
- Right-click the column header for the item you want to group by, and select Group By This Column.
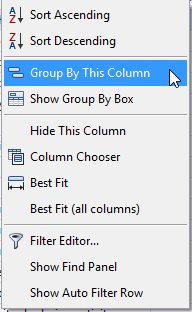 Figure 25: Group by This Column
The data is grouped by the column you select.
 Video: Group By This Column
- Right-click the column header for the item you want to group by, and select Show Group By Box. Drag the column header to the group by box.
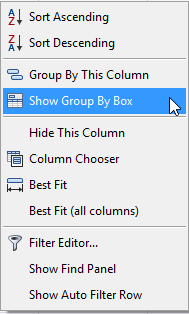 Figure 26: Show Group By Box Command
In the example below, the TRVs are grouped by Response, then by Change Type. Open and close each selection shows you the TRVs that are grouped in and under each column heading.
 Video: Show Group By Box
Expanding and Collapsing Groups
- To expand or collapse a group, click the arrow to the left of the name.
- To display all the records in all the groups, right-click and select Full Expand.
- To collapse any groups you have expanded, right-click and select Full Collapse.
- To show or hide the Group By box, right-click EITHER on the Group By box or in the column header, and select EITHER Show Group By Box or Hide Group By Box.
- To clear any grouping you have done, right-click on the Group By Box, and select Clear Grouping.
Copying Grid Data
The data in almost every grid in TariffShark can be copied to your Windows clipboard for use in other software programs. This feature is particularly useful for copying data out of TariffShark and pasting it into Microsoft Excel or into a Microsoft Word table.
- If you wish to copy data from a TariffShark grid, simply right-click anywhere in the grid and a context copy menu is displayed (as shown in Figure 27 below).
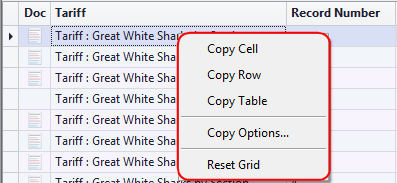 Figure 27: Copy Menu
Copy Cell
Selecting this option on the context menu copies the data from the selected grid cell into the Windows clipboard. Selecting "Copy Cell" and pasting into Excel would yield these results.
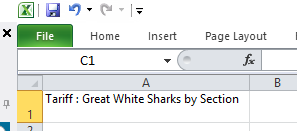 Figure 28: Copying a Cell
Copy Row
Selecting this option on the context menu copies the data from the selected grid row into the Windows clipboard where each cell of data is separated by a Tab character. Selecting "Copy Row" and pasting into Excel would yield these results.
 Figure 29: Copying a Row
Copy Table
Selecting this option on the context menu copies all data in the grid into the Windows clipboard where each cell of data is separated by a Tab character and each row of data appears on a new line. Selecting "Copy Table" and pasting into Excel would yield these results.
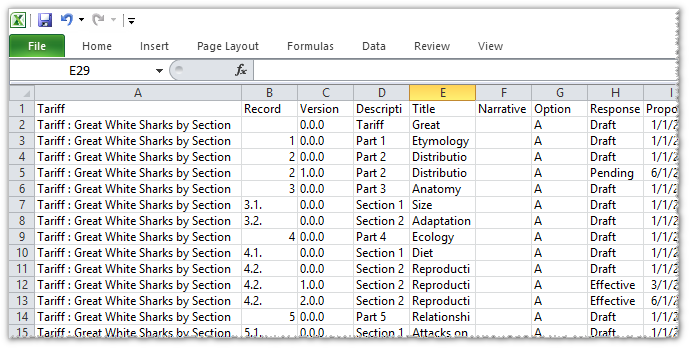 Figure 30: Copying a Table
Copy Options...
The Copy Options dialog, shown below, give you the ability to (1) choose which columns of data are copied when selecting the "Copy Row" or "Copy Table" options, (2) specify the order in which the columns are copied, and (3) choose whether or not column headings are copied to the clipboard.
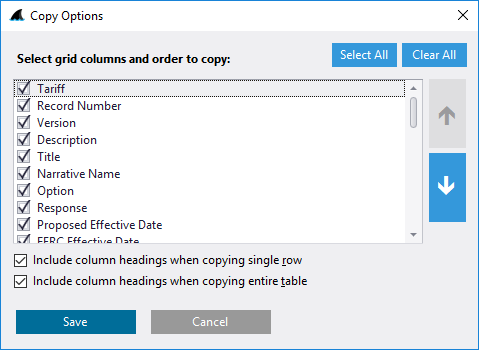 Figure 31: Copy Options
Pasting Into Microsoft Word
When pasting tab-delimited data into a blank Microsoft Word document, it appears initially as plain text and not as a Microsoft Word table. To convert the plain text into a table in Word simply follow the steps outlined below.
- Start with a grid (like List of Tariffs shown below), use the "Copy Table" command and then paste into a Word document.
 Figure 32: A grid (List of Tariffs) in TariffShark
Immediately after pasting the grid content into Word, it looks something like this.
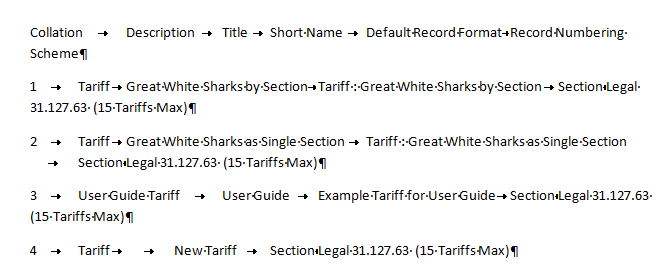 Figure 33: Plain text copied into Word
- Select all of the text that was pasted into Word.
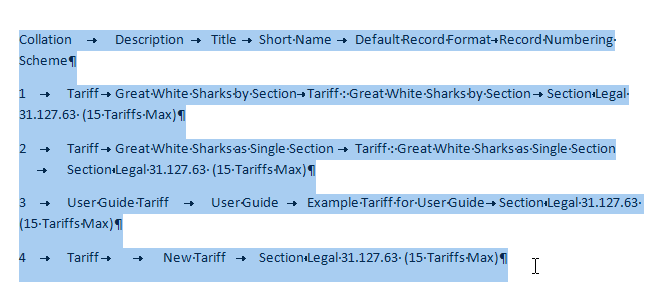 Figure 34: Selected plain text
On the Insert tab on the Ribbon, Go to "Table" and select "Convert Text to Table".
Complete the "Convert Text to Table" form and click the OK button.
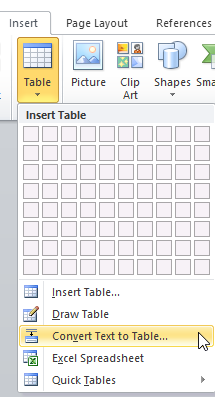 Figure 35: Navigation to Convert to Text to Table Form
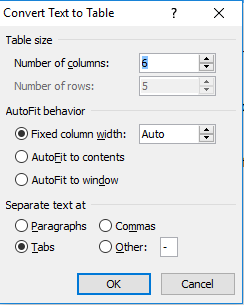 Figure 36: Convert Text to Table form
Below is the resulting table in Word.
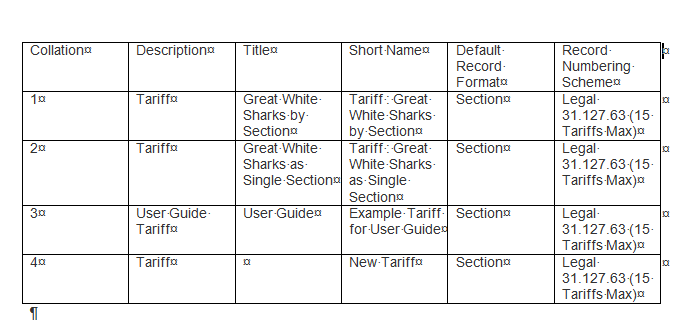 Figure 37: Formatted Table in Word
Find Panel (Searching)
You can perform a search to filter the data listed in the TariffShark .
Performing a data search using "Find Panel"
- Right-click any column header and select "Show Find Panel".
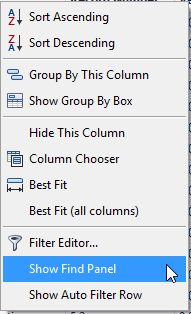 Figure 38: Navigating to "Find Panel"
- In the find panel, enter the search criteria, then click the Find button.
 Figure 39: Find Panel Form
Types of Searches are
| Search | Results | Example |
|---|---|---|
| A single term | Records that include the term | Wexton (shows records that include Wexton) |
| Multiple search terms separated by spaces | Records that include ANY of the terms | Wexton Johnstown (shows records that include Wexton and shows records that include Johnstown) |
| Search string enclosed in quotes | Records that include the entire string | "City of Wexton" (shows records that include City of Wexton but not City of Smithville or Wexton City) |
| Search terms separated by a + sign | Records that include ALL of the search terms | Wexton +Johnstown (shows records that include both Wexton and Johnstown) |
| Terms preceded by a – sign | Records that do NOT include the search term | Wexton –Johnstown (shows records that include Wexton but not Johnstown) |
Refer to the Search Syntax article for more examples.
Once you are done with your search, you can do ANY of the following:
- To clear the search criteria, either delete the search text, or click the Clear button.
- To perform another search, clear the search criteria, enter the new search text, and click the Find button.
- To close the Find Panel, either right-click on a cell and use the Reset button, or right-click on a column header and select "Hide Find Panel".
Resetting Grid Layout
After making changes to your grid such as sorting; filtering; removing, rearranging, or hiding columns; or grouping data, you can reset to its original, default layout.
- To reset your grid, right click on any cell within your grid and select "Reset Grid" command.
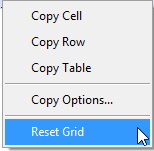 Figure 40: Resetting Grid